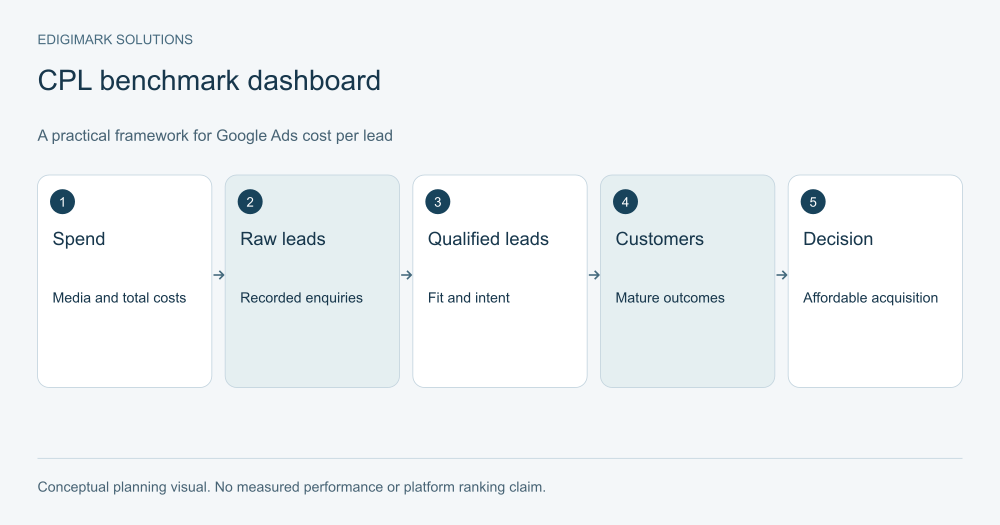
A good Google Ads cost per lead is one your business can afford for leads that are likely to become suitable customers. Calculate raw CPL, qualified lead CPL and downstream acquisition cost separately, then compare mature lead cohorts with consistent definitions. An attractive average CPL can hide poor lead quality, while a higher CPL can be commercially sensible when the enquiries are much more relevant.
There is no universal CPL benchmark that tells every company whether a campaign works. Industry, market, intent, offer, qualification and sales performance all affect the result. The useful benchmark starts with your economics and the outcomes you can verify.

How does the Google Ads cost per lead calculation work?
The basic formula is straightforward:
Media CPL = advertising spend ÷ recorded leads.
If an illustrative campaign spends 2,000 currency units and records 40 leads, its media CPL is 50 currency units. That number describes the cost of the recorded action. It says nothing by itself about whether the leads are suitable, whether they were counted correctly or whether they became customers.
Define the numerator and denominator clearly. Media-only CPL excludes management and page costs. A fully loaded lead cost includes the relevant operating costs. A “lead” might mean a form submission, a valid enquiry or an accepted prospect depending on the business. Those definitions should appear next to the metric.
Use the same time period and be alert to recording differences. Platform conversion attribution and CRM lead creation dates may not line up perfectly. Investigate those differences before treating a discrepancy as campaign failure.
What is qualified lead CPL?
Qualified lead CPL uses leads meeting an agreed quality definition in the denominator. That definition should reflect the offer: relevant business type, appropriate location, supported use case and a meaningful need. Qualification should not be a vague label applied differently by each salesperson.
Continuing the hypothetical example, suppose 20 of the 40 recorded leads meet the agreed criteria. With the same 2,000 currency units of media spend, qualified lead CPL is 100. If four become customers, the media acquisition cost per customer is 500.
These invented figures illustrate the relationships; they are not industry benchmarks or client results. The same raw CPL can produce very different customer economics when qualification and close rates differ.
Keep raw and qualified counts visible together. Hiding raw volume makes it harder to diagnose what happened. Hiding qualification makes it easy to optimise for submissions that do not serve the business.
How do lead-to-customer economics define an affordable CPL?
Start with an allowable acquisition cost per customer and the proportion of comparable leads that become customers. On a simplified media-only basis:
Affordable media CPL = allowable media acquisition cost × lead-to-customer rate.
If a hypothetical business can allocate 600 currency units in media per customer and expects one in ten comparable leads to become a customer, the implied affordable media CPL is 60. A lower close rate reduces that allowance; a higher close rate increases it, provided the estimate is reliable.
Do not use an optimistic lifetime-value estimate to justify lead costs without examining retention, margin and cash timing. A business may be profitable over a long horizon but unable to fund the gap between advertising spend and receipts.
Include other acquisition costs on a consistent basis. If sales effort, campaign management and creative must fit within the overall customer acquisition allowance, account for them before setting the media target.
This model supports a digital marketing decision; it does not guarantee that the auction will deliver leads at the resulting price.
Why can industry CPL benchmarks be misleading?
Benchmarks often combine campaigns with different markets, offers, attribution settings and lead definitions. A downloadable guide and a qualified consultation request are both sometimes reported as leads, but they do not represent the same decision.
A benchmark can also conceal how data was collected. Ask which countries, time periods, account types and conversion actions it includes. Check whether the number is a mean or a median, whether management costs are included and whether the sample reflects businesses like yours.
Use a credible benchmark as context for investigation. Do not use it as a universal pass or fail threshold. Your own mature cohorts and unit economics are usually more directly connected to the budget decision.
This guide deliberately does not invent an industry CPL table. A dashboard based on actual campaign segments and verified quality is more useful than precise-looking figures without a defensible source or matching definition.
How does search intent affect paid search lead cost?
A person searching for a specific service can be closer to a commercial decision than someone researching a broad concept. That may affect both click cost and conversion quality. A high-intent query can face strong competition, while a broad query can generate inexpensive but unsuitable attention.
For a hypothetical accounting service, “bookkeeping provider for ecommerce stores” and “what is bookkeeping” need different expectations. The first may support a service enquiry. The second may support education but attract many people outside the target audience.
Group performance by meaningful intent rather than only by keyword wording. Inspect actual search terms where available, the page they reach and the enquiry they produce. A phrase that appears relevant in planning can have an unexpected meaning in practice.
Do not assume every low-volume query is high quality. Specificity helps only when the search reflects a need the business can meet.
How does the offer change the CPL?
A low-commitment resource can attract more submissions than a substantial sales conversation. That may lower raw CPL while increasing the work needed to identify genuine buyers. A higher-commitment offer can produce fewer leads with clearer intent, but it may also exclude suitable prospects who are not ready yet.
Judge the offer in its intended role. An educational resource should be evaluated as part of a nurture process, with appropriate expectations about timing. A quote or demo request should be evaluated for suitability and progression.
Explain what happens after submission. If the page offers a guide, provide the guide. If it offers a consultation, describe the consultation. Misaligned expectations can weaken lead quality even when the initial conversion rate looks strong.
Conversion rate optimization should improve the usefulness and clarity of the offer, not simply remove every qualification signal to increase form counts.
Which measurement problems can distort CPL?
Duplicate conversions can make CPL look artificially low. Missing conversions can make it look artificially high. A button click counted as a lead can misrepresent a form that never completed. A change in conversion definitions can create an apparent improvement without a real commercial change.
Audit the conversion action, counting method, trigger and reporting context. Google’s conversion tracking troubleshooting guidance provides checks for tag and recording issues. Test the actual journey and compare a sample of submissions with CRM records.
Keep diagnostic interactions separate from the outcome used to judge the campaign. Google’s primary and secondary conversion documentation explains how actions can serve different reporting and bidding roles, subject to goal configuration. Review the actual account rather than relying on a remembered setup.
Document any repair so later reports explain why recorded CPL changed. A measurement improvement should not be presented as proof that the campaign suddenly became more persuasive.
What does a target CPA tell you about CPL?
Target CPA is a bidding target for a configured conversion outcome; it is not a contractual price for every lead. Google’s Target CPA documentation describes an average target and notes that setting it too low can reduce the opportunities reached.
If the selected conversion represents a weak action, achieving the target does not establish commercial success. The target should reflect a useful outcome and reliable signal. The platform’s optimisation cannot decide your lead qualification criteria for you.
Review achieved results with the relevant target, conversion definition and time period. Consider lead quality and downstream outcomes alongside the platform metric. Do not lower a target merely to make a dashboard look ambitious if the market and campaign evidence do not support it.
How can you improve CPL without damaging quality?
Begin with relevance. Remove clearly unsuitable demand, align messaging with the supported offer and direct visitors to a page that answers their decision. Then inspect friction: confusing forms, missing information, technical failures and unclear next steps.
Evaluate proof and trust. A relevant visitor may hesitate because implementation, pricing context or service limits are unclear. Adding accurate information can help suitable prospects decide without pretending the offer fits everyone.
Improve follow-up too. Lead-to-customer economics change when appropriate enquiries are routed correctly and contacted with useful context. CRM integration can preserve that context, while marketing automation can support acknowledgement and routing.
Measure the effect on qualified leads and customers. A change that lowers raw CPL but floods sales with unsuitable submissions may be a deterioration, even if the advertising report appears better.
What should the lead-cost dashboard contain?
Use a small set of connected measures: spend, recorded leads, valid leads, qualified leads, meetings or opportunities and customers where observable. Show the corresponding costs and the percentage progressing between stages.
Break out meaningful segments such as offer, intent group, product or geography. Keep definitions stable across those segments. A comparison between a resource download and a demo request should explain their different purposes rather than rank them solely by CPL.
Add cohort maturity and sales feedback. Recent enquiries may not yet have a final outcome. A high rejection rate needs a reason, such as unsupported geography, incorrect use case or missing contact information.
Data analytics can join the evidence into an actionable view. The dashboard should make the next investigation obvious, not bury quality behind a single average.
How should marketing and sales agree on lead quality?
Review a sample together. Include accepted leads, rejected leads and ambiguous cases. Agree on the conditions that matter and record reasons consistently. Avoid a definition that depends only on a salesperson’s intuition or an arbitrary company-size threshold.
Distinguish fit from readiness. A suitable business may be researching for a future project. An urgent enquiry may still be outside the product’s supported scope. Those cases call for different actions and should not be collapsed into one “bad lead” label.
Create a feedback loop that can influence the campaign. If many rejected enquiries share a mismatch, inspect the query group, ad and page. If leads fit but do not progress, investigate the offer and follow-up experience.
Qualification is useful when it changes decisions. A CRM field nobody reviews adds little value to CPL reporting.
How do you judge whether a high CPL is a problem?
Ask whether the cost exceeds the business’s affordable level for the actual lead quality, whether it is sustained over a meaningful period and whether it differs from a comparable mature cohort. Then investigate what changed.
Auction conditions, offer changes, page issues and measurement repairs can all influence recorded cost. A high CPL with strong downstream conversion may be acceptable; a low CPL with almost no qualified outcomes may not be.
Avoid a binary judgement from one number. Make a decision to improve, hold, expand or pause based on the connected evidence. Ask Edigimark to review your lead economics if your platform CPL and sales experience currently disagree.
How should a CPL comparison be presented responsibly?
Put the definition next to every number. A table comparing offers should state whether each denominator includes all submissions, valid enquiries or qualified leads. Show the counts too: a cost derived from a handful of outcomes carries more uncertainty than a mature, consistent record.
Explain differences in context. A new campaign may use a different offer, geography or landing page. A seasonal promotion can change buyer behaviour. A repaired conversion tag can change recording. Without that context, the team may credit or blame the wrong factor.
Where the report uses a customer conversion rate, identify the cohort and allow enough time for progress. Avoid calculating customer acquisition cost from this month’s spend and customers who entered the pipeline months earlier unless the reporting method deliberately handles that relationship.
Include a decision column. One campaign may need a relevance review, another a page improvement, and another more observation. A dashboard that highlights every high CPL in red can encourage superficial reductions even when quality is strong.
What should you do when sales rejects a lead without a reason?
Create a manageable reason list and allow a short explanation for ambiguous cases. The list should reflect actual mismatches rather than blame the channel. Examples might include unsupported requirement, unsuitable account, duplicate record or incorrect contact details.
Review the list periodically with campaign owners. If the reasons do not change any marketing or routing decision, simplify them. The purpose is a usable feedback loop, not administrative work for its own sake. Consistent rejection information makes lead-cost interpretation much more practical.
For recurring services, review whether the leads become customers who remain a good fit. A campaign that attracts contracts likely to churn quickly can look efficient at the first sale while weakening longer-term economics. Use observed retention where available and identify the uncertainty when the customer cohort is still new. Do not assign an assumed lifetime value to every lead and treat that estimate as earned revenue.
Frequently asked questions
Is a lower CPL always better?
No. Lower cost helps only when the leads remain suitable and commercially useful. A campaign can reduce raw CPL by promoting a less demanding offer or reaching a broader audience, while making customer acquisition more expensive. Track qualified outcomes alongside the initial count.
Should spam leads be included in CPL?
Keep raw recorded CPL available for diagnosing the platform and form, but report valid and qualified lead costs separately. Use consistent rules for spam and duplicates. Hiding rejected leads entirely can conceal a problem; treating them as useful prospects can conceal it too.
Can one CPL target cover every campaign?
It can be an internal boundary, but different offers and intent groups may have different quality and close rates. Evaluate whether a shared target supports the business. A resource campaign and a consultation campaign should not be judged as though every submission has the same value.
How long should leads mature before CPL is judged?
Raw CPL can be calculated quickly once recording is reliable, but commercial judgement needs enough time for qualification and sales progress. Use the business’s observed process and compare similarly mature cohorts. There is no universal waiting period for every market.
What should replace CPL as the main success measure?
Use the measure closest to the business decision that the data can support reliably: qualified opportunity cost, customer acquisition cost or contribution after acquisition, for example. Keep CPL as a diagnostic metric. It remains useful when its definition and limits are clear.
Put the ideas to work
Explore our connected growth services →