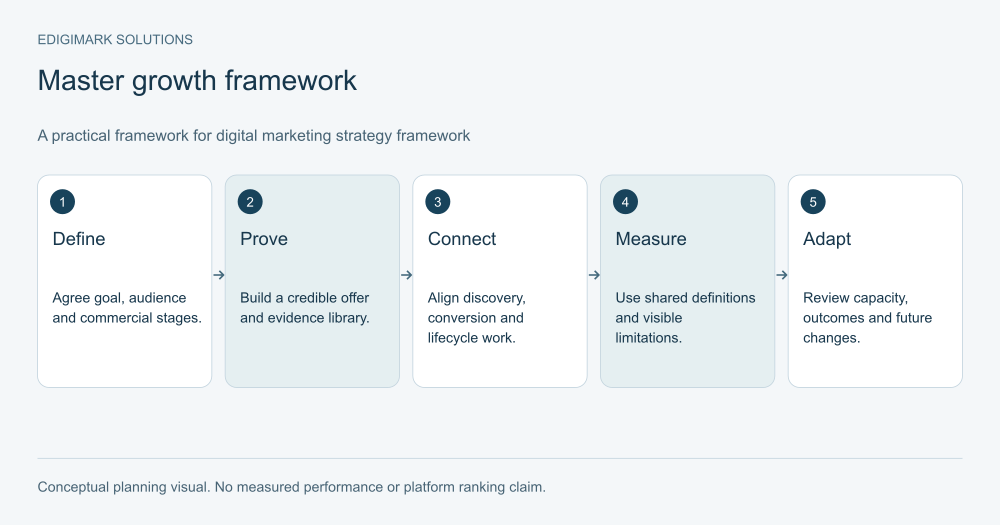
B2B marketing ROI compares a defined commercial return with the full cost of the marketing investment that supported it. Use contribution or gross profit consistently when you want an economic return, keep revenue and pipeline separate, and state the attribution assumptions. Pair ROI with customer acquisition cost and payback so the report explains both profitability and timing.
The calculation is straightforward only after the definitions are clear. A dashboard can show an impressive ratio while excluding salaries, using open pipeline as if it were revenue or assigning every deal to a single campaign. The practical work is building an honest cost and outcome model before calculating the percentage.
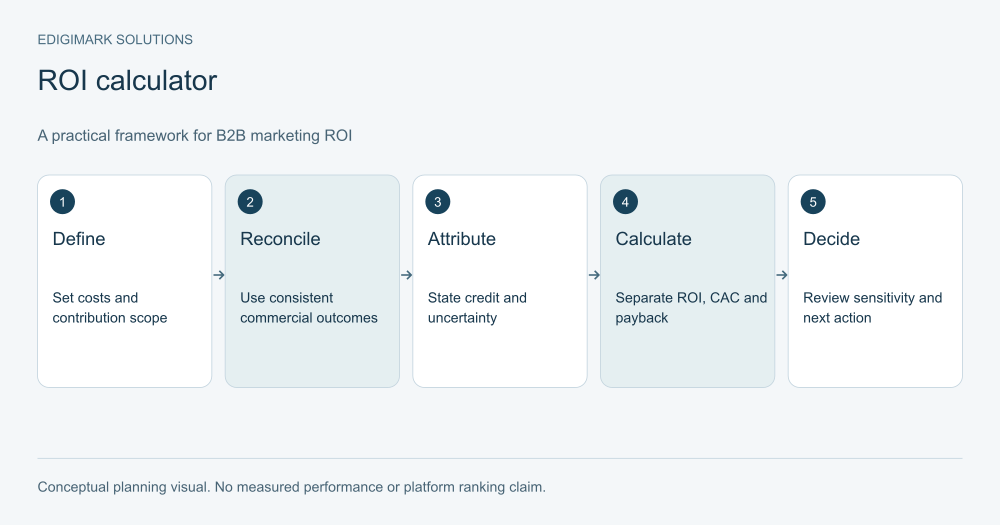
An editorial planning diagram; stages and examples are illustrative.
Which marketing ROI calculation should you use?
For an investment decision, a useful convention is: marketing ROI equals incremental contribution attributable to the activity, minus marketing investment, divided by marketing investment. Multiply by one hundred to express a percentage. Contribution means revenue less the variable costs included in your agreed definition.
If incremental contribution cannot be established, calculate an attributed-contribution estimate and label it accordingly. Attributed outcomes are allocated by a model; incremental outcomes represent what the activity changed relative to an appropriate counterfactual. They are not interchangeable.
Some teams use revenue in the numerator. That can be a useful revenue-efficiency ratio, but it does not account for delivery cost or margin. State the definition prominently and avoid comparing it with a profit-based ROI as if the measures were identical.
| Metric | Suggested definition | What it explains |
|---|---|---|
| Revenue-to-marketing-cost ratio | Attributed revenue divided by marketing cost | Revenue efficiency under the attribution convention |
| Contribution-based ROI estimate | Attributed contribution minus marketing cost, divided by marketing cost | Estimated economic return under stated assumptions |
| Customer acquisition cost | Defined sales and marketing acquisition cost divided by acquired customers | Cost per acquired customer |
| CAC payback | Acquisition cost recovered through customer contribution over time | Timing of recovery |
| Pipeline-to-cost ratio | Defined pipeline value divided by campaign cost | Early commercial association, not completed return |
These are planning definitions. Agree with finance on the accounting treatment and avoid implying they constitute a formal accounting or investment standard.
What belongs in the marketing investment total?
Include the costs required to deliver the activity: media, agency or contractor work, internal production, campaign operations, landing-page development, relevant software and the agreed share of supporting overhead. Apply the same allocation method across comparisons.
Be explicit about whether sales costs are included. Campaign marketing ROI and full customer acquisition economics serve different purposes. A narrow campaign report can exclude sales costs if that is its stated scope, but it should not be presented as the full cost of winning a customer.
Allocate shared resources thoughtfully. A comparison guide used by several campaigns should not be charged in full to every one of them. It also should not disappear from all campaign costs. Choose an allocation rule, document it and test sensitivity when the rule materially affects the result.
Separate one-time setup from ongoing operation where useful. A new tracking integration or content foundation may serve several periods. Show the treatment so a launch-period campaign is not compared unfairly with a mature campaign that benefits from earlier investment.
How do you choose a revenue definition?
Decide whether the report uses booked contracts, invoiced revenue, recognized revenue or collected cash. They describe different commercial events. A signed annual contract does not necessarily mean all revenue has been recognized or received.
Use finance-approved data when reporting completed commercial outcomes. CRM deal values can help pipeline review, but stage changes, discounts, cancellations and implementation conditions may affect the actual result.
Distinguish new-customer acquisition from expansion and retention. A campaign supporting an existing customer’s additional purchase has different acquisition economics from one introducing a new account. Report them separately when the distinction matters to the decision.
CRM integration services can connect opportunities to customer and transaction records. The integration should preserve identifiers and commercial definitions instead of simply synchronizing a field called “revenue.”
How does an illustrative B2B marketing ROI calculation work?
Consider a hypothetical campaign with a fully defined marketing investment of 20,000 currency units. Under the team’s stated attribution method, it is associated with 80,000 units of completed revenue. Assume the contribution margin relevant to the analysis is 50 percent, producing 40,000 units of contribution before marketing investment.
The attributed-contribution ROI estimate is therefore (40,000 minus 20,000) divided by 20,000, or 100 percent. The revenue-to-cost ratio is 80,000 divided by 20,000, or four. These numbers answer different questions.
This is a worked example using invented planning inputs, not an Edigimark or client result. It demonstrates why margin matters. If the same revenue produced only 20,000 units of contribution, the contribution-based ROI estimate would be zero under this convention, despite the revenue-to-cost ratio remaining four.
Now consider attribution uncertainty. If only half the contribution is assigned to the campaign, the estimate becomes (20,000 minus 20,000) divided by 20,000, or zero. Show that sensitivity rather than presenting one allocation as unquestionable truth.
How should you calculate customer acquisition cost?
Define the sales and marketing costs used to acquire new customers over the relevant scope, then divide by the corresponding number of acquired customers. HubSpot’s customer acquisition cost explanation emphasizes the inclusion of acquisition expenses beyond media alone.
Align costs and customers with the sales cycle. Dividing one month’s acquisition spending by another month’s unrelated closed customers can distort the result. Cohort analysis can provide a clearer view when the acquisition process spans several periods.
Use both blended and segment views where helpful. A blended CAC describes the overall acquisition system under the chosen definition. A segment or channel CAC can help prioritize investment, but shared costs and incomplete attribution require explicit treatment.
Do not divide by leads and call the result CAC. Cost per enquiry, cost per accepted lead and cost per acquired customer are separate metrics. They can diagnose different parts of the funnel.
What does CAC payback tell a B2B business?
Payback describes how long it takes customer contribution to recover acquisition cost under a defined model. For recurring revenue with stable contribution, a simplified estimate divides CAC by monthly contribution per acquired customer. Real customer cohorts may require a month-by-month model.
Use contribution rather than revenue when assessing economic recovery. Include the margin assumptions and relevant recurring delivery costs. If churn, ramp-up, payment timing or variable implementation cost matters, the simple steady-state calculation may be insufficient.
For a hypothetical customer with CAC of 6,000 units and stable monthly contribution of 1,000 units, the simplified payback estimate is six months. If contribution begins later or changes during onboarding, model those actual periods instead of assuming immediate steady-state value.
Payback does not tell the whole profitability story. A business can recover acquisition cost quickly and still face delivery, overhead or retention challenges. Use it alongside contribution, cash timing and cohort outcomes.
How should pipeline appear in the ROI report?
Pipeline is evidence of commercial evaluation, not completed return. Report its stage, definition, value and timing assumptions separately from closed revenue. A large open opportunity may never convert or may close outside the period being assessed.
If you calculate weighted pipeline, explain the probabilities and their source. They should reflect your own historical stage evidence where available, not a universal set of percentages copied from a template.
Keep pipeline creation and pipeline influence distinct. A campaign associated with an existing opportunity may support progression without creating the original evaluation. The report should preserve prior status and avoid double-counting the same deal across totals.
Data analytics services can organize these relationships with clear metric definitions. A useful report shows the evidence available and the assumptions still required.
How do attribution assumptions change the result?
An attribution model assigns commercial credit to recorded interactions. Different conventions can produce different campaign-level outcomes from the same underlying journey. Google explains this role in its attribution guidance.
Some meaningful influences may be unrecorded: colleague recommendations, private sharing, partner conversations or earlier anonymous research. The last recorded click is not necessarily the sole cause of a purchase. A model can organize evidence without observing everything.
Present a base case and sensitivity when the decision warrants it. Change the attribution share, margin, cost allocation or outcome timing to see whether the investment conclusion remains robust. A result that changes dramatically under plausible assumptions needs a cautious interpretation.
Use controlled experiments where feasible to examine incremental effects. Their design depends on sample size, buying cycles and operational constraints. Do not label a before-and-after comparison causal merely because the later period performed better.
What should a practical ROI worksheet record?
Record the business question, activity scope, cost period, outcome period, cohort definition, revenue convention, contribution treatment, attribution method and unknown coverage. Include the owner of each data source.
List every included cost and any excluded cost that materially affects interpretation. Record the allocation method for shared production or technology. If a setup cost serves future periods, explain whether it is charged immediately or allocated for this management analysis.
For outcomes, preserve customer and opportunity identifiers, relevant dates and any adjustment status. Cancellations or value changes should update the analysis rather than leaving the original pipeline amount permanently counted as return.
The worksheet should make another analyst able to reproduce the result. If the calculation relies on an unrecorded judgement about which deal belongs to a campaign, document that judgement and its rationale.
How can marketing improve ROI without reducing useful investment?
Diagnose the constraint. Poor-fit acquisition suggests audience or offer refinement. Strong enquiries with weak follow-up suggest an operating problem. Suitable evaluations stalled by uncertainty suggest better implementation or decision resources.
Cutting cost is only one possible action. It can improve a ratio while reducing useful commercial contribution. Compare total outcomes, marginal opportunities and capacity rather than optimizing a percentage in isolation.
Conversion rate optimization services can help address the conversion experience and lead quality. Marketing automation services can help repair lifecycle handoffs when qualified interest is lost through inconsistent follow-up.
Review cohorts after changes. If qualification criteria shift, show the effective date. If attribution changes, recalculate comparatives where possible or state that the periods are not directly comparable.
What should an executive ROI report emphasize?
Lead with the commercial question and the resulting decision. Explain the investment, observed outcomes, estimated economic return and the assumptions that matter. Show pipeline as a separate leading view.
Use a concise confidence statement based on evidence quality. A reconciled customer cohort with dependable costs supports stronger conclusions than a campaign with uncertain source coverage and incomplete opportunity records. Avoid giving both the same visual precision.
Include the next action and its owner. The report may justify expanding a suitable audience, improving a handoff, revising an offer or stopping an ineffective test. It should explain why that decision follows from the evidence.
Contact Edigimark to build a marketing measurement model that connects campaign activity, commercial records and practical investment decisions.
How do you reconcile the ROI example before presenting it?
Create a cost ledger with the invoice or allocation behind each entry. Match commercial outcomes to a defined customer or opportunity cohort. Confirm the revenue convention and contribution treatment with the responsible finance owner. Keep the calculation reproducible without relying on an analyst’s memory.
What if revenue changes after the first report?
Apply a documented adjustment rule. A cancellation, discount, delayed implementation or credit can change the economic outcome. Preserve the original report date and the revised value so later readers understand why the result changed.
Do not allow open pipeline estimates to remain permanently counted as realized return. Separate forecast views from reconciled outcome views, and state the point at which an opportunity becomes eligible for completed-revenue reporting.
How should sensitivity be communicated?
Show the assumptions that materially affect the decision. In the hypothetical example, attribution share and contribution margin both change the ROI estimate. A short table with a conservative, base and optimistic planning case can be more informative than a single number with several hidden dependencies.
Label these scenarios as assumptions. They are not probability estimates unless the business has a method for estimating those probabilities. The purpose is to test whether the investment conclusion survives plausible changes.
How do you avoid optimizing the wrong ratio?
A higher ROI percentage can accompany lower total contribution if the team stops useful investment. A lower average ratio can accompany worthwhile expansion if the additional activity produces positive contribution within capacity and risk constraints. Examine both the ratio and the absolute commercial outcome.
The same principle applies to CAC. A cheaper acquired customer may have weaker retention or higher service cost. Segment and cohort evidence help determine whether apparent acquisition efficiency translates into a useful customer relationship.
What should the report recommend when evidence is weak?
Recommend the next measurement or operating step rather than inventing certainty. The business may need a cleaner CRM association, an agreed cost allocation, a longer observation period or a bounded experiment. An honest report can support a practical decision even when it cannot produce a definitive causal return.
Frequently asked questions
Is ROAS the same as B2B marketing ROI?
No. Return on advertising spend usually compares attributed revenue with ad spend. A broader ROI analysis can include other marketing costs and a contribution or profit definition. State the scope before comparing ratios.
Can pipeline be used as revenue in the calculation?
Keep it separate. Pipeline describes open commercial evaluations and uncertain future value. It can support an early indicator, but it should not be presented as completed revenue or realized return.
Should sales salaries be included?
Include them in full acquisition economics under your agreed CAC definition. A narrower marketing campaign analysis can use a different scope, but disclose that scope and avoid calling it the full customer acquisition cost.
What is a good marketing ROI percentage?
There is no universal answer without margin, risk, timing, cost definitions and business constraints. Evaluate the return against your own economics and alternatives, with assumptions clearly stated.
What if attribution data is incomplete?
Report known coverage, preserve unknown outcomes and use sensitivity analysis. A transparent estimate is more useful than forcing every deal into a confidently named campaign.
Put the ideas to work
Explore our connected growth services →