Website speed, SEO and conversions are connected through the experience people have when they find, read and use your pages. Loading delays, unresponsive controls and unexpected layout movement can obstruct a useful task. Measure those problems with field performance data and targeted diagnostics, repair the important barriers and evaluate commercial outcomes separately. A better performance score does not guarantee a ranking increase or a particular conversion uplift.
“Speed” is often treated as one number, but a page can show its content quickly and still respond poorly to a form interaction. Another can appear stable at first and shift when a later asset loads. A business needs to understand the task affected, not only the overall score.

In this guide
- How are website speed SEO and conversions connected?
- What do the Core Web Vitals measure?
- Why can lab and field performance data disagree?
- Which customer journeys should website performance measurement cover first?
- How should field performance data be collected and interpreted?
- What should a page performance diagnosis inspect?
- How should images be reviewed without weakening the page?
- How should third-party tools be prioritised?
- How can speed and UX be evaluated together?
- How should the Core Web Vitals business impact be reported?
- What does a practical speed-to-conversion illustration show?
- How should performance be maintained after a release?
- How should a 2027 performance plan be prepared?
- What should a performance repair ticket contain?
- How can a small team choose between competing performance repairs?
- Frequently asked questions
How are website speed SEO and conversions connected?
Search visibility, page experience and commercial action are related but distinct. An accessible, useful page needs relevant content and technical quality. A visitor who reaches it still needs an offer they understand and an action they can complete.
Google’s page-experience guidance says Core Web Vitals are used in ranking systems, while good scores do not guarantee top rankings. It also advises against treating a perfect score as the only goal. Relevant content and the wider experience remain important.
For conversions, performance can remove an obstacle without creating demand. A faster form cannot make an unsuitable service suitable. A quick product page still needs accurate specifications and fulfilment information.
Web development, digital marketing and conversion rate optimization should therefore share the performance priorities and the customer task they support.
What do the Core Web Vitals measure?
The current Core Web Vitals cover loading, responsiveness and visual stability. Google’s Web Vitals documentation identifies these measures and recommended good thresholds:
| Metric | Experience measured | Good threshold |
|---|---|---|
| Largest Contentful Paint (LCP) | Loading of the largest relevant visible content element | 2.5 seconds or less |
| Interaction to Next Paint (INP) | Responsiveness to user interactions | 200 milliseconds or less |
| Cumulative Layout Shift (CLS) | Unexpected layout movement | 0.1 or less |
The field assessment uses the 75th percentile, with mobile and desktop considered separately. The measures can evolve, so verify current documentation when building a future plan.
These thresholds are experience guidance, not a revenue calculator. Passing them does not prove that the offer converts or that the page will rank for a particular query.
Why can lab and field performance data disagree?
Lab data is collected under controlled conditions. Field data describes observed user experiences across differing devices, networks and interactions. Google’s lab and field explanation describes why those views can differ.
Use lab tools to reproduce and investigate a problem. Use field evidence to understand whether and where users experience it. A single lab run cannot represent every visitor, while an aggregate field report may not identify the precise cause.
Check the reporting scope. A tool may show page-level data where available or broader origin-level information. Do not assume that a visible result describes one exact page if the tool indicates a wider scope.
When data is unavailable, say so. A small or new site may lack sufficient public field observations. That absence is not proof that performance is good or bad; it changes the investigation method.
Which customer journeys should website performance measurement cover first?
Prioritise pages and tasks with clear commercial roles: service enquiry, product evaluation, checkout, trial activation or booking. Include important entry pages and the steps after them.
Test representative templates rather than only the homepage. Product pages, articles, service pages and forms can use different assets or scripts. A fast homepage does not prove the checkout works smoothly.
Record the actual task and device context. A delay opening a menu, selecting a variant or submitting a form may matter even if the first content appears promptly. Inspect the public route, including normal campaign parameters and external steps.
Choose priorities from audience relevance and task impact. An issue affecting suitable buyers on a key route can deserve attention before a decorative improvement on a low-value page.
How should field performance data be collected and interpreted?
Start with available tools and understand their scope. Google’s measurement guide describes CrUX-based tools and the value of a site’s own real-user monitoring for more immediate and detailed observations.
Record the metric, page or template, device group, period and relevant release context. Avoid comparing values from different scopes or methods as though they were interchangeable.
Look for patterns that support a decision. A particular template or interaction may be more useful to investigate than the site-wide average. Keep the data collection proportionate and appropriate to the information needed.
Data analytics can organise the evidence. The report should identify a task and possible cause to investigate rather than present a long metric list without ownership.
What should a page performance diagnosis inspect?
Inspect what the browser loads and what delays the useful content or interaction. Large images, unnecessary scripts, third-party tools and server behaviour can contribute in different ways. The actual cause needs evidence from the affected page.
Google’s Core Web Vitals improvement guidance provides technical areas to investigate. Use it as a diagnostic resource rather than applying every suggestion blindly to every site.
Connect each proposed repair with the observed problem. If the main image arrives late, inspect its delivery and priority. If an interaction stalls, inspect the work blocking response. If content shifts, inspect what changes the layout.
Verify the repair in realistic conditions and check that essential functionality remains. Removing a script can improve a score while breaking a form, consent interface or payment process if its role was not understood.
How should images be reviewed without weakening the page?
Check whether the asset’s dimensions and format suit its display and purpose. A small card rarely needs the same resource as a large detailed diagram. Keep essential readability and product accuracy when changing the image.
Provide an appropriate fallback and preserve layout space where the implementation requires it. Test the result on relevant screen sizes and verify that the image remains meaningful.
Do not optimise by deleting useful evidence simply because it adds weight. A genuine product view can be important to the decision. Seek an efficient implementation that preserves the information.
Content and development should review the change together. The technical owner understands delivery, while the page owner confirms that the asset still communicates the required detail.
How should third-party tools be prioritised?
Inventory their purpose, owner and effect on the task. Analytics, forms, booking, support and marketing tools can have legitimate roles, but unused or duplicated integrations add complexity.
Check whether the tool is required on every page and whether it affects the important interaction. Any loading or execution change should preserve appropriate consent and the intended functionality.
Verify the full process after a change. A scheduling widget that loads faster but loses available slots is not an improvement. An analytics change that removes duplicate recording should be documented so reported commercial rates are interpreted correctly.
Assign ownership for ongoing review. Tools added by different teams can remain long after the campaign or project that required them ends.
How can speed and UX be evaluated together?
Observe the task, not only the load. Ask a representative person to find requirements, choose an option and complete the action. Note delays, confusing states and unexpected movement.
Performance can interact with expectations. A control that appears active before it can respond can confuse a visitor. A success message arriving without a clear change may leave them uncertain whether the action worked.
Keep accessibility and clarity in the review. A quick interface still needs usable controls, instructions and feedback. Performance should support the experience rather than compete with those requirements.
Use technical evidence to investigate what the observation reveals. A person’s frustration identifies a practical issue; a diagnostic trace helps locate the implementation cause.
How should the Core Web Vitals business impact be reported?
Report the performance change and the commercial observation separately. A metric improvement confirms something about the measured experience; an enquiry or revenue change requires its own evidence and interpretation.
Consider traffic mix, offer changes, promotions, availability and measurement repairs. These can influence conversion during the same period. Do not attribute an entire revenue increase to speed simply because both moved.
Use a controlled experiment where the question, traffic and implementation support it. Otherwise, describe before-and-after evidence with limitations. A correlation between faster visits and more purchases can be useful for investigation without proving a causal uplift.
Keep meaningful guardrails: functioning forms, suitable leads, order quality and essential interface behaviour. A higher lab score achieved by removing important functionality is a poor business result.
What does a practical speed-to-conversion illustration show?
Imagine a hypothetical product page where a selector responds slowly and the visitor cannot tell whether the chosen variant changed. The team reproduces the issue, identifies the relevant implementation and repairs the response and feedback.
It verifies the selector, basket and checkout. It then reviews relevant task completion and commercial outcomes with appropriate context. It does not promise that each millisecond saved produces a fixed percentage of additional sales.
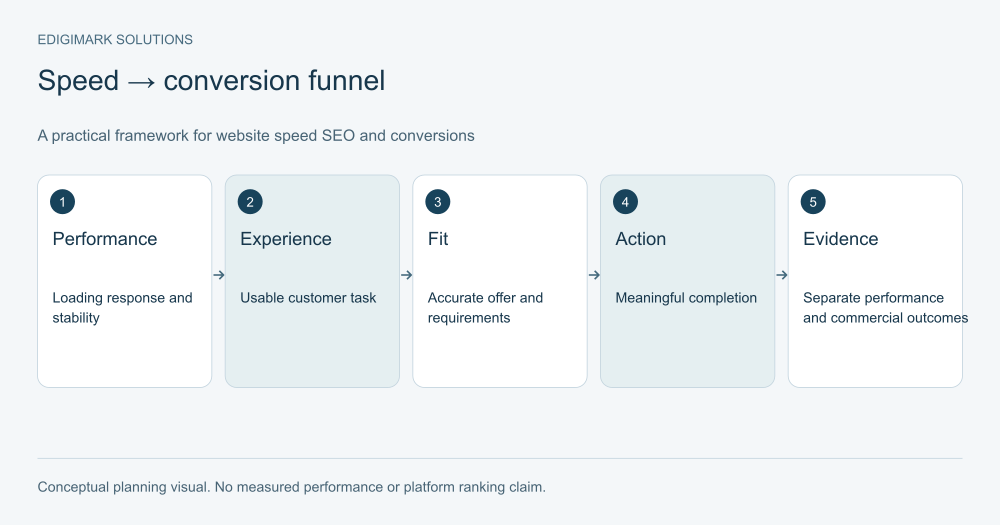
The accompanying diagram shows a conceptual chain: loading and interaction quality support a usable task, which supports an informed action when the offer fits. It is not a chart of measured client uplift.
This example highlights the practical value of performance work: reducing an observed obstacle rather than chasing a number disconnected from the customer.
How should performance be maintained after a release?
Record the page or component changed and repeat important task checks. New assets, plugins, scripts and integrations can alter performance or functionality.
Use a baseline and a review process appropriate to the site. Technical diagnostics can identify regressions, while field observation shows user experience over time. Keep the owner and response process clear.
Review the commercial pages when the offer changes too. A new product view or form can introduce different resource requirements. Web development should understand which journeys deserve particular protection.
Performance is ongoing website quality work. It should remain connected with accurate content and reliable actions after the initial optimisation project closes.
How should a 2027 performance plan be prepared?
Use the current documented metrics as a starting point and schedule a review of official changes before implementation. Do not treat future thresholds or search-system behaviour as known facts.
Inventory critical journeys, establish available field evidence, identify diagnostic gaps and assign ownership. Include resources for verified repairs and task testing.
Prioritise the audience’s experience and the business decision. A plan built around maintaining useful, responsive pages will be more adaptable than one promising a particular ranking gain from a score target.
Ask Edigimark to connect performance with your customer journey if speed reports and commercial priorities currently lead to different task lists.
What should a performance repair ticket contain?
A useful ticket begins with the affected route and the customer task. “Improve mobile speed” is too broad to verify. “Reduce the delay when a mobile visitor changes a product variant, while preserving price and availability updates” gives development and the page owner a shared target.
Attach the conditions that reproduce the issue: device class, relevant network setting, selected option and release version. Include the observed behaviour and the expected behaviour. A recording can show the confusing state, while a diagnostic trace helps investigate its cause. Do not turn one observation into a claim that every visitor has the same experience.
Write acceptance criteria for both performance and function. The selector must show the correct variant, the basket must receive it, and the response must be checked with the agreed measurement method. If the repair affects other templates, list those checks too. This makes the commercial purpose visible when a technical implementation is reviewed.
Assign someone to validate the public page after deployment. A successful local test does not prove that caching, asset delivery or production integrations behave identically. Record the deployment date so subsequent field observations can be interpreted against the release.
How can a small team choose between competing performance repairs?
Use a short decision record rather than a fabricated revenue forecast. Describe the audience affected, the importance of the task, the confidence in the diagnosis and the effort required to implement and verify the change. Keep estimates labelled as estimates.
For example, a hypothetical service business finds a recurring form interaction delay and a heavier image on an infrequently visited archive. The form issue has a clear task consequence and a reproducible cause. It may reasonably take priority even if the archive produces a worse isolated lab score.
That decision can change when new evidence arrives. If the archive is an important entry point for suitable visitors, its impact deserves a fresh review. If the form repair depends on replacing a complex integration, a simpler verified image improvement may be completed while that work is prepared.
Do not combine every factor into an unexplained health score. A visible priority list with reasons, owners and dependencies is easier to challenge and maintain. The score can summarise a decision; it should not hide the assumptions that produced it.
Keep the decision record with the release notes. Future reviewers can then understand why a component changed and which customer task the team intended to protect.
Frequently asked questions
Does a perfect PageSpeed score guarantee better rankings?
No. Google’s page-experience guidance says good Core Web Vitals do not guarantee top rankings. Relevance and other factors matter. Use performance measures to improve user experience rather than treating a perfect score as a purchased ranking outcome.
Are Core Web Vitals the same as load time?
No. The current set covers loading, responsiveness and visual stability. A page can load visible content quickly and still respond poorly to interaction. Measure the experience relevant to the visitor’s task rather than relying on one duration.
Which data should matter more: lab or field?
They serve complementary purposes. Field data helps describe actual experiences; lab data helps reproduce and diagnose issues under controlled conditions. Understand scope and conditions before comparing them. Neither should be interpreted without the task and implementation context.
Can faster pages increase conversions?
Removing a performance barrier can help suitable visitors act, but the effect depends on the offer, audience and change. Measure meaningful outcomes and other influences. Avoid universal claims that a specific time saving guarantees a fixed uplift.
Should useful features be removed to improve speed?
Review their purpose and implementation first. Unused or duplicated tools may be removable, while essential forms or product information need an efficient reliable approach. Verify functionality and user choices after changes rather than improving a score at the expense of the task.